


CPI or EPI, or Both?
From personal and family financial planning to policy formulation aimed at sustained improvement in livelihoods of the community, people’s living expenses constitute a crucial factor. As described by the Census and Statistics Department of the Hong Kong SAR Government (see Note 1), the Consumer Price Index (CPI) measures the changes over time in the price levels of consumer commodities and services typically purchased by households. A rise in the CPI indicates that, with expenses remaining unchanged, the amount of commodities and services people can buy decreases. In other words, changes in the CPI reflect the inflation faced by consumers. However, given the CPI’s discrepancies in calculating people’s daily expenses, this article discusses its limitations and also proposes using the Everyday Price Index (EPI).
Blind spots in the current index
The Census and Statistics Department announces monthly CPI changes, the predominant indicator of local price variations. The public can access the data through news media. Nevertheless, with an inadequate understanding of the CPI, people may be under the misconception that the price changes they observe in their daily activities are fully reflected in the CPI readings. As a matter of fact, a feature news report last year attempted to debunk the “myth of low inflation”. A number of the interviewees in the news story projected an actual inflation rate higher than the official data released and regarded the latter as “unrealistic” (see Note 2).
Objectively speaking, there are indeed blind spots in the CPI, which make it a less-than-ideal index of daily living costs. One of the reasons is that the less frequent expenditure section has a higher weight in the composition of the index. In the 2019/20-based Composite CPI (see Note 3) prepared by the Census and Statistics Department, housing has the highest expenditure weight, exceeding 40% (see Table). Meanwhile, expenses such as food and transport are more frequent than non-daily expenditures (e.g. rent and furniture), exerting a more notable effect on people’s impression of inflation.
Table
| Sections and groups of commodity/service | Composite Consumer Price Index (CCPI) |
| Overall price change | 100 |
| Food | 27.41 |
| Housing | 40.25 |
| Electricity, gas, and water | 2.82 |
| Tobacco and alcoholic drinks | 0.49 |
| Clothing and footwear | 2.42 |
| Durable goods | 4.00 |
| Miscellaneous goods | 3.32 |
| Transport | 6.17 |
| Miscellaneous services | 13.12 |
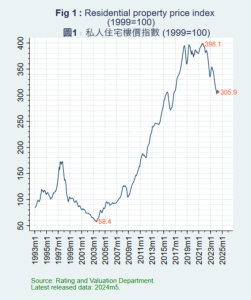
Take the statistical data between 2019 and 2024, for example (see Note 4). In the Composite CPI (CCPI), the year-on-year change rates of housing are lower than those of food and transport. Due to the highest expenditure weight of housing (see Figure 1), the CPI is more susceptible to price changes in housing and less sensitive to those in daily expenses such as food and transport. Consequently, the daily living costs during this period were underestimated.

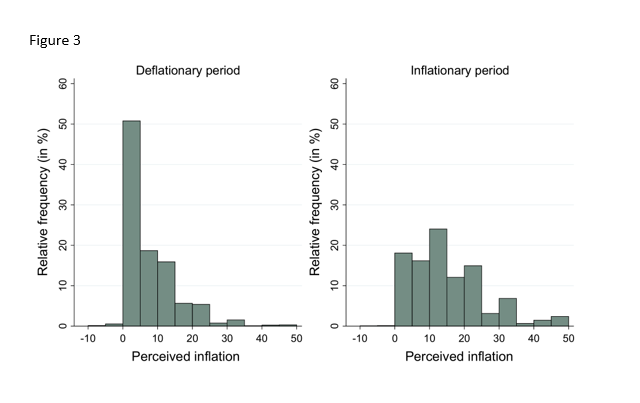
People are generally more concerned about price rises in commodities and services but are less impressed by, or aware of, price cuts, which is a form of “memory bias”. Daily-consumed commodities and services experience not only higher frequency of expenditure but also more frequent price changes. With reference to a Polish academic study (see Note 5) on consumers’ perception of year-on-year inflation rates between 2004 and 2017, up to 99% of respondents to a questionnaire survey indicated that they were unaware of the 28-month-long deflation from July 2014 to October 2016 (see Figure 2). Of these respondents, 43% stated that prices remained unchanged and 53% were under the impression that prices increased instead of decreased (see Figure 3).
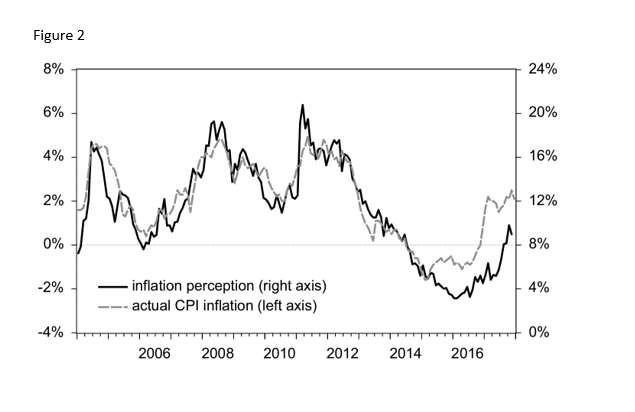
Moreover, the base effect can mislead people to overestimate inflation. For instance, a $1 price rise in lettuce selling at $10 per catty at wet markets represents a 10% hike. The low base value of daily expenses can easily cause the general public to think inflation is higher than it is. The Polish study also demonstrated that even when inflation perception more or less aligned with the actual CPI inflation, respondents still overestimated inflation by an average of 10 percentage points (see Figure 2). The author further pointed out that discrepancies between the CPI and public perception of inflation were not exclusive to Poland but were also common among EU countries, suggesting that the CPI might not reasonably estimate changes in daily living costs. To summarize the above three points, the CPI as an inflation indicator does deviate from people’s daily-life experiences, thus conveying the impression of being unrealistic.
Unveiling the EPI
In view of the fact that the CPI fails to accurately measure changes in daily living costs, the American Institute of Economic Research has introduced the EPI as a more reliable price indicator (see Note 6). Unlike the CPI, the EPI covers only daily goods and services and purchasing these items cannot be readily delayed or cancelled. These goods and services must satisfy the following two requirements. First, they must be purchased frequently (at least once a month); therefore, durable goods (e.g. furniture and household electrical appliances) are excluded. Second, their prices must not be fixed for six months or more through, for example, a contract; hence, contract-bound expenses such as rent are not covered (see Note 7). The EPI more closely reflects daily expenses and can more correctly register changes in daily living costs in comparison with the CPI. In fact, the compilation of the EPI is simple and straightforward. It can be established based on the CPI by removing items not covered by the EPI and adjusting expenditure weights accordingly.
By referencing the EPI, people should be able to more effectively plan their personal financial expenditures. Not only can the grassroots obtain comprehensive and objective data when demanding wage adjustments, but the government can also have a better grasp of people’s livelihoods. In contrast, the CPI as a price indicator has been criticized because the inflation perceived by the general public deviates significantly from the actual inflation figures.
While this can be attributed to an inadequate understanding among the public regarding the composition of inflation, it is undeniable that the CPI cannot precisely reflect daily living costs. If the government continues to rely solely on such a tool, it would inevitably give the impression that it is out of touch with reality.
By approaching this issue through policy, the Government can incorporate the EPI as a reference index for social-welfare adjustments. As for the Social Security Allowance Scheme (e.g. the Old Age Allowance) and the Comprehensive Social Security Assistance Scheme, which have been pegged to the CPI, the upward adjustment of allowances has been less than ideal. Relevant policies could better benefit the public by incorporating the EPI as a more realistic indicator.
Limitations and applications of the indices
Yet, the EPI is not perfect and may overestimate the daily living costs across the community. As a matter of fact, when people see a price rise in a certain product, they naturally seek a replacement, so their actual expenses may not necessarily go up. Needless to say, spending habits vary from person to person. The EPI is for reference only and everyone should estimate changes in their expenses according to their own consumption habits.
We must emphasize that the EPI can by no means replace the CPI. It is indeed only right for the two to co-exist. While the EPI reflects changes in people’s regular daily expenses, the CPI provides an overall picture of consumer price changes in society, including both regular and irregular expenditures. The CPI is a major index widely utilized around the world. Considering the different purposes and functions of the two indices, users should be flexible when using or referencing them in various scenarios.
For instance, for the government and the academic sector, apart from recurrent expenditures, since constant monitoring of overall price changes is conducive to shaping policies and to comparing prices across regions, the CPI is a more suitable reference. When it comes to daily living costs, the EPI can more accurately reflect expense changes. For this reason, the EPI is a valuable tool for personal finance planning and a useful reference for social-welfare policy development.
Last but not least, different indices have different pros and cons. While an ideal index should be simple to use and easy to understand, users also need to grasp its uses and limitations and must not blindly accept or misuse it. Otherwise, no amount of indices can provide them with any real help.
As mentioned at the beginning of this article, given their inadequate knowledge of the CPI, members of the public often misunderstand the implications of the data. In this connection, the government should be more proactive in stepping up public education and publicity. In addition to introducing the EPI as well to account for living cost changes in response to social needs, officials should further explain to the community the uses of different indices to clear up any misconceptions.
Note 1: https://www.censtatd.gov.hk/en/data/stat_report/product/B8XX0021/att/B8XX0021.pdf
Note 2: Now Business News, 經緯線 低通脹之謎
https://www.youtube.com/watch?v=_12qhhUQM2Y&t=525s (interview duration: 08:36–10:32)
Note 3:https://www.censtatd.gov.hk/tc/EIndexbySubject.html?pcode=B8XX0029&scode=270
In addition, starting with April 2024 as the reference month, the Census and Statistics Department updated the reference period for the CPI expenditure weights to the entire year of 2023. This update does not affect the descriptions of expenditure weights in this article, except for slight differences in the actual figures.
Note 4:
https://www.censtatd.gov.hk/en/data/stat_report/product/D5600001/att/D5600001B2024MM06B.xlsx
Note 5: https://link-springer-com.eproxy.lib.hku.hk/article/10.1007/s41549-019-00036-9
Note 6: https://www.aier.org/research/capturing-shifts-in-everyday-prices/
Note 7: https://www.aier.org/wp-content/uploads/2015/07/WP004-EPI-Polina-Vlasenko-PV.pdf