Dr Yim-fai Luk
21 May 2025
To the surprise of most, consensus was readily reached on a truce at the recent tariff talks between China and the US in Geneva. For the time being, tariff rates have reverted to the levels prior to the so-called “Liberation Day”, though the international landscape can hardly return to its previous state. The US president Donald Trump has been manipulating “negotiation tactics”, with the asking price constantly fluctuating―now high, now low; now real, now fake. Both carrots and sticks are used to create more room for negotiation. Nevertheless, due to a lack of underlying strength and messy logic, the trade war resembles poorly-executed acrobatics on the part of the US, pushing the Global Economic Policy Uncertainty Index to a historical high (see Note 1).
After over a month of turmoil, Trump’s tariff myth has now been debunked. Despite his claim that tariffs would be paid by foreign countries, he demanded Walmart absorb the tariff-induced additional costs instead of passing them on to consumers, soon after the company notified its customers of the price increase. Despite his claim that tariffs will revitalize America’s manufacturing industry and create jobs, Trump criticized Apple CEO Tim Cook for moving the production of iPhones to India instead of relocating it to the US.
What is more, the sharp reactions from financial markets worldwide to both rising tariffs and temporary tariff pauses further highlight the negative economic impacts of America’s tariff sticks. The Trump team cannot help but retract their previous claims, admitting that tariffs do have short-term effects though they will ultimately do more good than harm to the country in the long run.
So far, apart from reaching an insubstantial agreement with the UK, the US has made little headway in its trade negotiations with other countries. The 90-day pause on the “reciprocal” tariffs is scheduled to end on 9 July 2025. Many countries are starting to see through America’s tough façade and have decided to observe how other nations fare to gauge America’s bottom line. Their hesitation to kowtow is becoming more and more embarrassing for the US. A few days ago, Trump and Treasury Secretary Scott Bessent said separately that America will unilaterally levy the “reciprocal” tariffs announced on “Liberation Day” on other countries if they show no interest in negotiating. This is an American modus operandi to browbeat other countries. Nonetheless, a solution will need to be found and there may be opportunities for breakthroughs in the coming weeks.
Misconception: imports curb domestic production
Trump and his cabinet must have their views and reasons, though not necessarily correct, to go to such lengths with their tariff weapon. They are even gambling with America’s economy and global image. Below is a discussion of this based on two macroeconomic identities 101.
America’s gross domestic product (GDP) figures for the first quarter of 2025 announced at the end of last month reveal a real growth rate decline of 0.3% on an annualized basis compared with the previous quarter. Public opinion in the US shows that this is the result of American businesses importing foreign products in bulk before Trump’s tariff hikes take effect. Mainstream media outlets, including The Wall Street Journal, The Washington Post, Bloomberg, and CNBC, have reported this view. The rationale is that imports have reduced domestic production.
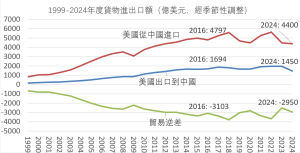
By this logic, the huge amount of Chinese exports to the US over the decades has contributed significantly to a reduction in US production and economic growth while displacing American workers. One of the reasons why Trump has been elected as president twice is his ability to take advantage of this public sentiment, highlighting his commitment to using tariffs to resist foreign goods and protect the interests of America and its workers. His trade advisor Peter Navarro has echoed similar claims over the years.
It is, in fact, a misconception that imports will curb domestic production. Simply put, imports are “foreign production”, i.e. the volume of imports affects foreign rather than domestic production. This may not completely clear all doubts, so let us focus on the GDP.
Macroeconomics 101 textbooks usually explain how to measure GDP with the following equation: Y = C + I + G + EX – IM, where Y represents GDP, C stands for consumption, I represents real investment, G is government expenditure, EX denotes exports, and IM represents imports. More often than not, readers may mistakenly think that since IM is subtracted, an increase in IM will result in a corresponding decrease in Y. However, this equation is just an accounting identity. With production volume already fixed (e.g. GDP from the previous year), to find the total value, a simpler way is to calculate the sum of the components on the right side of the equation. To understand the relationship between imports or trade deficits and GDP, it is essential to look beyond this equation by incorporating hypotheses and analyses related to economic behaviours.
Imports, investment, and consumption cancelling each other out
Suppose that in anticipation of the tariff hikes, US companies import foreign goods in advance. Despite the increase in imports, this is not the only economic activity. If the imported goods are then stored in warehouses, in the above equation, corporate inventory investments (i.e. part of I) will accelerate with imports, thus cancelling each other out without changing Y (GDP). If the imported goods are immediately sold to consumers, that will be tantamount to a rise in consumption and, in the above equation, C and imports will go up simultaneously and cancel each other out.
Similarly, if the goods are imported by the government rather than by enterprises, there will be a corresponding surge in G.
In other words, the slight contraction of US GDP in the first quarter of 2025 has nothing to do with the increase in imports by American companies prior to the implementation of new tariffs, but is caused by other factors. By the same token, any change in the value of IM will generally result in corresponding change in C, I, or G but will not affect domestic production.
Assuming the demand for imports is to replace domestic products, this means local consumers will buy fewer local products and switch to foreign products instead, causing domestic production to fall. However, strictly speaking, import behaviour alone will not directly reduce domestic production. A cut in production only occurs when consumers stop buying local products for some reason. If the reason is that local products cannot compete with cheaper and better foreign goods, then cutting back on domestic production in uncompetitive sectors and enabling consumers to purchase more affordable imported goods could be a suitable approach. In so doing, freed-up resources may be reallocated to more competitive industries. In addition, imports and domestic production are not necessarily mutually exclusive. They can complement each other, particularly when importing parts, components, and raw materials is involved. In such cases, the greater the import volume, the higher the domestic production.
All in all, the relationship between import volume or trade deficits and GDP presents multiple possibilities. More imports do not invariably result in less domestic production. On the contrary, limiting imports by tariffs or other trade barriers does not necessarily benefit domestic production and may even backfire. In the past few years, while the US has seen continued growth of expanding imports, the country’s unemployment rate has remained at a historical low of 4% (with the exception of the period of the coronavirus pandemic). This contradicts the view that imports hinder domestic production.
No direct causal link between current account deficits and foreign capital inflows
Another macroeconomic identity misused by the Trump administration is the notion that current account deficits equal net inflows of foreign capital. The current account primarily consists of the trade balance. For the sake of simplicity, the minor parts are left out of consideration here. Foreign capital inflows refer to the use of foreign capital within a country, similar to loans provided by foreign entities for domestic purposes.
To explain why current account deficits are equivalent to inflows of foreign capital, consider the US as an illustrative example. The fact that the US runs up trade deficits, meaning that Americans consume more foreign goods than foreigners consume American products, implies that, regardless of transactions at the individual or corporate level, the additional foreign goods consumed by Americans are, in effect, provided on temporary loan to the US by foreign entities. The larger the trade deficit, the greater the debt the US owes other countries, or alternatively, the greater the inflow of foreign capital. The coexistence of these two phenomena represents the two sides of the same coin.
Even if the US prints more money to settle its trade deficits, this will still translate into debts owed to other countries. It is because US dollars function not only as liabilities of the Federal Reserve but also as assets for foreign holders. Nonetheless, the nominal return on cash holdings of US dollars is zero, in contrast to that generated by US dollar-denominated bonds.
The equivalence between a current account deficit and capital inflows is also an accounting identity. Although it does not represent any causal relationship, the Trump team insists on framing it as follows.
Since the greenback is the primary foreign exchange reserve currency, central banks around the world have been purchasing US dollars in foreign exchange markets, leading to an appreciation of the dollar against other currencies. As a result, on the one hand, America’s rising imports and declining exports have created a colossal long-term trade deficit, a contraction of manufacturing, higher unemployment among workers, and a reliance on foreign goods. On the other hand, foreign countries enjoy trade surpluses, which they convert into US government bonds through deployment of the US dollars earned. Expanding foreign holdings of US bonds would pose a threat to the dollar’s status as a reserve currency and to US national security.
In other words, the fact that foreign capital has been flowing into the US to acquire dollars and US treasury bonds, leading to a trade deficit and diminished domestic manufacturing, appears to support the claim that America provides the world with a reserve currency, only to end up shouldering economic losses. To “Make America Great Again” and to mitigate America’s “grievances”, Trump has dramatically raised tariffs on many trading partners and is toying with the idea of converting existing US Treasury bonds into 100-year, non-tradeable zero-coupon bonds.
However, these narratives simply do not tally with reality. First, the value of US treasury bonds held by foreign central banks hovered around US$4 trillion from 2012 to the end of 2024, and even showed signs of a slight decrease (see Note 2).
This indicates that, on the whole, foreign central banks have not increased their holdings of US treasury bonds as foreign reserves while America’s current account deficit has expanded substantially since 2020.
Furthermore, if the share of manufacturing employees among non-farm employees is used as an indicator of manufacturing’s importance to the American economy, this proportion has progressively fallen from 35% at the end of the Second World War to approximately 8% today (see Note 3). Yet, over the same period, the US dollar’s exchange rate has experienced multiple fluctuations. For example, the real effective exchange rate of the dollar drastically declined from 118 at the time of the signing of the Plaza Accord in 1985 to 90 a few years later. The rate remained low for several years, with no change in the speed or trend of the decline in the share of manufacturing employees.
It may well be that the economic narratives of politicians merely serve the purposes of influencing public opinion and serving political ends. Only four months into Trump’s second term, the logic underlying US economic policy is already riddled with contradictions and barely coherent. During the presidential campaign last year, voters generally regarded economic policy as Trump’s forte, but according to a recent Reuters survey, only 37% of respondents still have the same view. It seems likely that the Global Economic Policy Uncertainty Index will continue to fluctuate at high levels in the next few years.
Note 1: https://www.policyuncertainty.com/
Note 2: https://fred.stlouisfed.org/series/BOGZ1FL263061130Q
Note 3: https://fred.stlouisfed.org/graph/?g=cAYh