US Election and the Domestic and Global Economy

Sparked off by Donald Trump’s refusal to accept the result of the presidential election defeat, the riot at the US Capitol in early 2021 is still fresh in memory. Now that the world is faced with treacherous geopolitics, the next US presidential election is fast approaching. The imminent election is of particular historical significance as there may be the first-ever woman and ethnic-minority president or the first former president to stage a comeback in many years. More importantly, with both American society and the international situation becoming dangerously volatile, even more crises loom in the years ahead.

Top issues in the eyes of 81% of voters

Within the short span of the past few years, not only have the Russia-Ukraine war and the Israel-Hamas conflict broken out, but Europe and America have also been battling record-high inflation in 40 years. Additionally the US has been waging a high-pressure technology war on China and AI technology has been advancing in leaps and bounds. All these developments have prompted various strategies and alliances. Who in the White House will lead America and what policies it will take could well change the course of history. Other national leaders are probably also contemplating how to mitigate the risks of the upcoming US presidential election.

Policies that matter to American voters centre around the economy, healthcare, immigrants, abortion, gun control, diplomacy, etc., with different concerns among Republican and Democratic supporters. Generally speaking, the economy is the primary consideration. According to the survey report published by the Pew Research Centre early last month (see Note), the economy tops the list of issues for voters, with 81% ranking it as very important, far ahead of healthcare in second place (65%). As for climate change, it receives little attention overall, largely due to the lukewarm attitude of Trump’s base.

The US economic performance has always been a deciding factor in election outcomes. A clear case in point dates back to 1992, when Bill Clinton popularized the campaign slogan “It is the economy, stupid”. Looking back over a century of American election history, if there was no economic recession two years prior to the election, the incumbent always got re-elected. There have been 12 such cases, including Bill Clinton, George W. Bush, and Barack Obama. If there was an economic downturn two years before, the incumbent invariably failed to get re-elected. Using this as a criterion, Joe Biden would have stood a fairly good chance of winning. Now that he has been replaced by Kamala Harris as the contestant against Trump, it remains to be seen in five weeks whether history will repeat itself for the presidential candidate from the same political party.

At present, the US macroeconomic situation indicates that inflation has abated and is gradually approaching the Federal Reserve’s 2% target. With the unemployment rate standing at approximately 4%, which is historically low, all appears to be well on the surface. Some still worry that a recession is brewing: the Federal Reserve started the interest-rate reduction cycle just two weeks ago with a 0.5% cut, higher than general market expectations and perhaps reflecting a faster-than-expected economic slowdown. Nevertheless, it is hard for Americans to grasp the economic outlook and use it as a reference for their vote. Most people would probably base their judgement on their own experiences, possibly to the disadvantage of Harris.

Voters have more confidence in Trump

Biden’s tenure as president coincided with the highest US inflation rate – peaking at 8% – over the past four decades. The Federal Reserve Economic Data show that the real median income of full-time employees dipped by 0.8% between the first quarter of 2021 and the second quarter of 2024. In other words, the rise in prices during the period was virtually offset by that in wages. Despite this, voters would still be unhappy because most of them believe that they deserve a pay rise for their hard work while price growth is seen as a result of policy failure. Now that inflation has more or less stabilized, so long as it stays positive, average prices will not come down. Few voters would recall whether there has been a pay rise when they see higher prices after Biden assumed office.

Just how much of these sentiments will be projected onto Harris is unclear. Given that she has not been involved in setting economic policy, voters may not blame her for the inflation. On the other hand, the fact that she lacks any accomplishments in economic affairs is her Achilles heel. In the Pew Research Centre study, more voters believe Trump has better economic policies, with a 55% to 45% ratio compared to Harris. This marks a particularly significant “advantage” for Trump among various policy issues.

As for foreign economic and trade activities, based on Trump’s campaign rhetoric, it is only natural to expect that he will continue the unilateral policies from his previous tenure a few years ago. Focusing solely on American interests, he will reduce or withdraw from multilateral economic cooperation agreements. His main weapon being tariffs, he insists that the burden of punishment should be borne by the countries targeted. He has also expressly said that, if re-elected, apart from imposing a 60% tariff on Chinese imports and a 10% tariff on imports from other countries, he would bring back the jobs “stolen” by foreign workers and reduce Americans’ income tax using the tariff revenues.

The toll of tariff hikes on Americans

Upon entering the White House in early 2017, Trump succeeded in passing the Tax Cuts and Jobs Act (TCJA) at the end of the year, but some income tax cuts would be effective only until 2025. He was looking to maintain lower tax rates in the long term and to offset reductions in income taxes with revenues from tariffs. This was obviously meant to hoax and coax American voters into believing income tax cuts were to their advantage without realizing tariff hikes would push up the prices they pay for imports. Trump has recently upped the ante by saying that it is possible to raise import tariffs on other countries from 10% to 20% and impose a 100% tariff on nations in pursuit of de-dollarization (naturally including China).

After conducting data analysis of Trump’s plans, the renowned US think tank Peterson Institute for International Economics (PIIE) finds that revenues from the tariffs can hardly cover even a portion of the income tax reductions. At its peak in 2022, these tariff revenues made up only 1.2% of the federal government’s total tax revenue, and China was already the largest source of America’s imports. Considering the average tariff rate for imports from other regions is lower than that for Chinese imports, the tariff revenue will not be substantial. In 2023, the total revenue from tariffs accounted for only 2% of the federal government’s total tax revenue while individual income tax revenue constituted 49%. Even if Trump succeeds in implementing steeper tariffs, they will not be sufficient to compensate for revenue reductions in individual income tax or corporate profit tax.

The PIIE analysis also covers Trump’s proposal to maintain the TCJA’s lower individual income taxes while imposing a 60% tariff on Chinese imports and a 20% tariff on all other imports. This would mean ordinary American families would continue to pay lower income taxes but would end up paying higher prices for foreign products. A family with a median income would suffer a net loss of US$2,600 each year. Only the top 1% of earners, who qualify for higher income tax exemptions, would benefit from Trump’s plans.

Simply put, Trump’s trade and tariff proposals would not only be loss-inducing for most but would also deteriorate income distribution.

Harris expected to follow in her predecessors’ footsteps

As a result of the trade war that started in 2018, the US has imposed tariffs of up to 25% on Chinese imports. While retaliating in kind, China still sought to leave room for negotiation and dispute management. Following rounds of high-level government negotiations, the Phase One Economic and Trade Agreement was signed by the two nations in January 2020. However, in the wake of the COVID-19 pandemic, which disrupted international trade, more heavy-handed measures were introduced by Biden after his assumption of office to suppress China. The room for China-US economic cooperation has thus become even narrower. Should the US impose tariffs of up to 60% or even 100% on all Chinese imports, China is bound to retaliate with a vengeance and the likelihood of a full economic decoupling between the two countries will become greater. Besides, since they are the world’s two largest trading nations, with various supply chains involving multiple third-party economies, costs in global trade and commerce will surge due to a reshuffling of the deck among trading nations.

The foreign economic and trade policies Harris will come up with remain to be seen given that they are not her department. It is estimated that she will not deviate from the policies of Biden or of the previous Obama administration in the short run. If that is the case, she would continue to rally European and Asian allies against China and Russia. But considering the Global South’s economic growth and the weak European economy, America may have the will but not the power to do so. For example, despite strong efforts from Biden, both the Indo-Pacific Economic Framework for Prosperity targeted at China and attempts to mobilize support from Africa and Latin America have been to no avail.

Without new ideas on the horizon, Harris may focus on existing platforms to rejoin the Comprehensive and Progressive Agreement for Trans-Pacific Partnership (CPTPP), initiated by the Obama administration. First, the Asia-Pacific remains the fastest-growing and most promising region in the world. Despite being located outside the region and having yet to reach any major trade agreement post-Brexit, the UK has become a CPTPP member. Second, through the CPTPP platform, the US can reshape its economic leadership role worldwide, demonstrating a willingness to actively cooperate with other countries to enlist support from its allies and the Global South economies. Third, this can also help to balance out China’s economic influence within the region. America’s participation in the CPTPP may attract more countries to join, thereby rivalling the Regional Comprehensive Economic Partnership. In fact, China has applied to enter the CPTPP. If the US becomes a member first, it will have yet another platform to restrain China.

The US presidency is won by electoral votes rather than the popular vote and so the swing states play a decisive role in the election. According to the economic growth rates for the second quarter of 2024 released by the US Bureau of Economic Analysis several days ago, quite a few swing states, especially Michigan and Wisconsin, perform better than the national average. If this short-term economic performance can be translated into election votes, Harris’ path to the White House will be plain sailing.


Note: https://www.pewresearch.org/politics/2024/09/09/issues-and-the-2024-election/


Dr. Y. F. LUK
Honorary Associate Professor in Economics

Read More

How to Create a Triple-Win Situation in the Platform Economy

Professor Heiwai Tang, Mr Benson Lam, and Mr Cyrus Cheung

25 September 2024


Now that the gig economy has become a global trend, striking a delicate balance among labour rights, business interests, and technological advancements is a focal point for policymakers around the world. According to Statista data, gig workers are estimated to make up 51% of the American workforce by 2027. In Hong Kong, as more and more people take on short-term contract and freelance jobs, there is room for improvement in the conventional labour protection system.

The interactions of labour rights, commercial interests, and technology are so complex that policymakers and industry leaders must walk a fine line to find the right balance. On the one hand, technological advancements and low costs of gig work provide the conditions for the take-off of the platform economy, which, in turn, has created a great variety of flexible, autonomous jobs as alternative sources of income beyond traditional employment. On the other hand, the market dominance of platform companies has drastically weakened the bargaining power of gig workers, who find themselves at the mercy of the companies.

Against this backdrop, this article aims to give an overview of changes in labour laws in Mainland China, the US, the UK, and Singapore, in an effort to spark further policy discussions on the gig economy. Admittedly, local situation varies across countries while policy outcome remains to be seen. While referencing experiences from overseas, it is essential to consider the local situation so as to balance business innovation and development against the need to protect gig workers’ interests by setting a sustainable development framework.

Taking a page from the Mainland, the US, the UK, and Singapore

The gig economy is thriving in the Mainland. In a recent internal letter, Meituan CEO Wang Xing reportedly disclosed that in 2023, a total of 7.45 million food delivery riders received remuneration exceeding RMB80 billion from the Meituan platform. Apart from these riders, gig jobs like ride-hailing drivers or content creators are also very common in the Mainland.  The general public is increasingly concerned about the social responsibility of big platform honchos regarding the protection of gig workers’ rights. Under the guidance of departments such as the All-China Federation of Trade Unions, the online food delivery platform Ele.me signed the industry’s first collective contract covering its entire service network with more than three million riders in July 2023. This action was taken in response to riders’ concerns about protecting workers’ rights, insurance benefits, grievance redress channels, etc. Ele.me has now established a dispute arbitration centre in Shanghai to optimize its internal dispute resolution mechanism.

In the face of the expanding gig economy, the Chinese government has come to play a prominent role in protecting labour rights and benefits. In 2024, the Ministry of Human Resources and Social Security issued a series of documents, including the Guidelines for Guaranteeing the Rest and Labour Remuneration Rights and Interests of Workers in New Forms of Employment and the Service Guidelines for Safeguarding the Rights and Interests of Workers in New Forms of Employment. These guidelines define the rights of “workers under new employment arrangements” in three areas — wage standards, rest time, and channels for rights protection. The government policy stipulates that salaries of workers in new forms of employment should match local minimum wages per hour. If workers are required to work on statutory holidays, they should receive higher wages than for normal working hours. To ensure that workers have necessary rest time, the regulations mandate that once a worker’s hours reach the specified limit, platforms must immediately stop sending them orders for a certain time. If their labour rights are compromised, these workers can seek protection through the company’s internal dispute resolution process or through rights protection services provided by trade unions, relevant departments, and agencies.

In the US, innovation and technology enable companies to leverage digital platforms to develop their markets while the government’s role lies in ensuring fair labour practices. Generally speaking, only “employees” are protected by federal and state labour laws. However, some better-developed states have put in place their own legislation to protect gig workers’ rights. For example, New York passed the rule in 2023 to significantly adjust the minimum pay rate of delivery workers from US$7.09 to US$17.96. Unfortunately, the city’s decision drew ire from the industry: Platform companies such as Uber Eats, DoorDash, and Grubhub have filed lawsuits with US courts. Meanwhile, the companies are transferring the costs of raised wages to restaurants and consumers. With the rise in delivery fees, consumers have started to order less through food delivery platforms, leading to livelihood difficulties for delivery riders.

Labour relations in the UK encompass three types of employment classification: employees, workers, and the self-employed. In 2016, Uber drivers took their employer to court, claiming that they should receive such benefits as paid annual leave and minimum wage protection. After six years of litigation, the UK Supreme Court ruled that the drivers were workers rather than self-employed persons. Uber nevertheless still insists that the ruling only applied to drivers using its app in 2016, not all its current drivers. The Labour Party, which recently came to power, had put forward progressive proposals during the election in Labour’s Plan to Make Work Pay: Delivering a New Deal for Working People. The party pledged to ban exploitative zero hours contracts and require employers to provide staff with contracts that state predictable hours, based on a 12-week reference period. Nonetheless, some gig workers may prefer to retain the flexibility of being classified as “workers” rather than “employees”. Whether the intermediate employment classification, i.e. “workers”, should be abolished remains a debatable issue.

Singapore is well known for its business-friendly environment and its entrepreneurship. It places great importance on technological advancement, laying the foundation for the platform economy. To safeguard labour rights, the country recently passed the Platform Workers Bill to provide protections for its approximately 70,000 platform workers. Similar to the UK, the Bill classifies “platform workers” as a separate legal category that falls between employees and the self-employed to ensure their Central Provident Fund contribution rate will rise to match that of current employees and employers. Platform operators are required to provide their platform workers with work injury compensation insurance at the same level of coverage as employees. In addition, the Bill stipulates the formation of Platform Work Associations to ensure collective bargaining rights, including negotiations with platform operators and the signing of legally-binding collective agreements. Reportedly, Singapore may eventually consider extending the scope of the Bill to cover other freelancers.

While China, the US, the UK, and Singapore have attempted to introduce policy measures to protect the rights of gig workers, differences exist among the regulations. In comparison, the policies of China and Singapore involve more negotiations between employers and employees, whereas those of the US and the UK do not. This may be due to the fact that gig worker protection policies are a more contentious issue in the US and the UK. In any event, policy measures to protect the rights of gig workers have yet to fully mature and the outcomes of their implementation remain uncertain.

Flexible regulatory framework essential to robust growth  

How to regulate the platform economy is another major issue. According to Peking University’s Institute of Digital Finance, regulation should aim to strengthen the platform economy and to facilitate its healthy growth, rather than hindering its future growth. It is therefore necessary to establish a comprehensive governance mechanism for the platform economy. This should include the formulation of specialized and systematic regulations as well as a clear demarcation of departmental responsibilities so as to avoid the phenomena of “campaign-style regulation” and “regulatory competition”. Moreover, to prevent over-intervention in normal market operations, it is advisable to distinguish between “regulation of the platform economy” and “antitrust” — the former being a proper function for maintaining market order and the latter being a non-normal measure for restoring market efficiency.

The success of the platform economy hinges on the creation of reasonable income for companies and gig workers while consumers benefit from highly efficient platform services, altogether delivering a triple-win. Given the dominant position of platform operators, the government must play an active role in ensuring a balance among labour rights, business interests, and technological applications. That being said, the flexibility of the regulatory framework is crucial since over-regulation may compromise the effectiveness of platforms in managing supply and demand, producing a triple-lose outcome for operators, gig workers, and consumers. Finding balance on a seesaw is no easy task. How to build a sustainable development framework for the gig economy remains an issue in urgent need of further deliberation.


References

黃益平、鄧峰、沈艷、汪浩(2022)〈超越「強監管」──對平台經濟治理政策的反思〉,北京大學數字金融研究中心

Read More

Worrying Fiscal Predicament Looms Large for the US

Dr Maurice Tse
18 September 2024

The US presidential election is now proceeding at full throttle. Long advocated by the Republican candidate, Donald Trump, measures including tax cuts, increased military spending, and economic stimulation are bound to pump up the government’s fiscal expenditures. His Democratic opponent, Kamala Harris, on the other hand, calls for expansion of social programmes, boosted infrastructural investments, and economic stimulus initiatives. While a tax hike is on the table, without a corresponding growth in revenue, federal debt will only stack up over time.

Over the past five years, the US government’s fiscal deficit has persistently remained above US$1 trillion while its debt level has been among the highest in the world. Surprisingly, neither of the two presidential candidates regards this as a priority. One cannot help but wonder if America’s economic future is at risk of a debt time bomb, potentially fulfilling the prophecy of the fall of the West.


International standards for financial assessment

When evaluating a country’s financial situation, it is necessary to understand that debt is the total sum of money owed at any particular time while a deficit occurs when the government’s spending surpasses its income, leading to larger national debt. Fiscal deficit and debt are usually compared against Gross Domestic Product (GDP) as the latter serves as a rough indicator of a country’s solvency.

Using a collection of data covering the period from 1946 to 2009, gathered from the International Monetary Fund, the World Bank, and the Organization for Economic Cooperation and Development, American economists Carmen Reinhart and Kenneth Rogoff have conducted a study on 44 countries. Their work reveals a significant negative correlation between the government debt ratio and economic growth. In developed economies and emerging economies with a debt-to-GDP ratio over 90%, the median growth rate is lower by 1.5% and the average growth rate is lower by nearly 3% compared to economies with smaller debt obligations.

A government’s annual fiscal-deficit-to-GDP ratio consistently over 3% would cause alarm for many economists and international organizations. Take the European Union for example. Its Stability and Growth Pact, introduced in 1997, is designed to maintain sound public finances and facilitate economic growth by overseeing and controlling member states’ budget deficit levels and public debt levels. Under the pact, the annual budget deficit of each member is capped at 3% of its GDP and the public-debt-to-GDP ratio must be kept below 60%. Assessed against these criteria, the steadily high US fiscal deficits and public debts are inevitably a cause for concern among scholars and pundits regarding America’s economic future.

Under the catalytic effect of virtually zero interest rates and low debt costs over the past decade, escalating government debts have become a global issue. In June 2023, US President Joe Biden signed the Fiscal Responsibility Act passed by the Congress, which suspended the US$31.4 trillion debt ceiling until January 2025. At the beginning of 2024, the overall debt of the federal government stood at US$33 trillion, approximately US$28 trillion of which was held by the American public.


The federal government’s towering debt

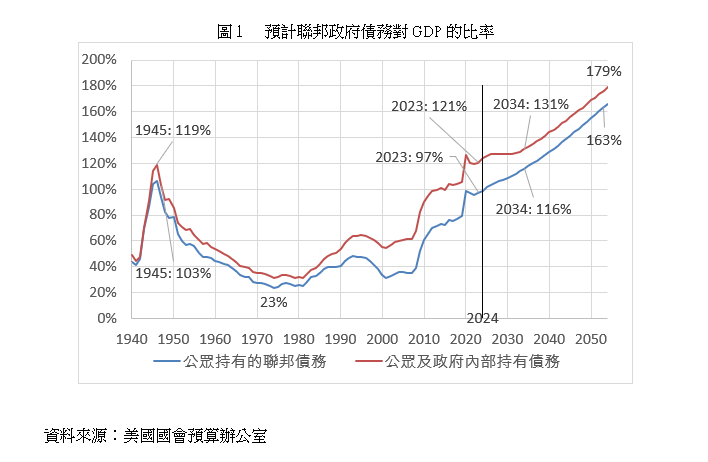
Figure 1 shows that the US public-debt-to-GDP ratio in 2023 almost reached 100% while the total debt-to-GDP ratio exceeded 120%, the highest level since the 103% recorded at the end of the Second World War. Thanks to strong economic growth and financial surplus, the total debt-to-GDP ratio fell to 23% in 1974. Upon Bill Clinton’s departure from the White House in 2001, that ratio registered at 32.8%. Since then, the US has seen fiscal deficits for 23 consecutive years.

As a matter of fact, the debt-to-GDP ratio approaching 100% is not necessarily a problem; rather, what causes concern is the continuous upward trend. The Congressional Budget Office (CBO) forecasts that the ratio will reach 116% by 2034 and even 163% by 2054. A persistent trend is sure to hamper the US economy in the long term.


Critical fiscal imbalance

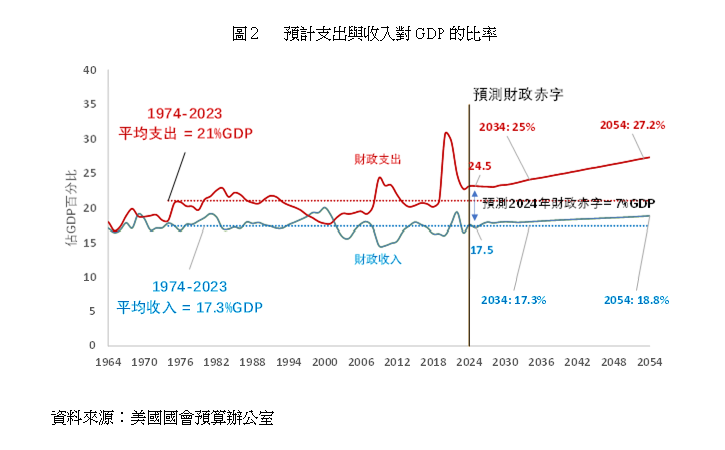
In June 2024, the CBO adjusted its forecast for the deficit for the same fiscal year, raising the amount by more than US$400 billion to US$2 trillion, which equated to 7% of GDP (see Figure 2). During the COVID-19 pandemic, the national deficit rocketed to an all-time high of US$3.13 trillion, representing 14.7% of GDP. By 2021, the deficit totalled US$2.78 trillion, or 11.8% of GDP.

CBO data indicates that US fiscal deficit has been accelerating: averaging US$138 billion in the 1990s, US$318 billion in the 2000s, US$829 billion in the 2010s, and even averaging US$2.23 trillion in the 2020s. During the past three years, massive deficits have arisen in an environment of economic growth, low unemployment, and stable national defence spending. The CBO therefore regards these deficits as structural and projects that the accumulated deficit between 2025 and 2034 will stand at the high level of US$22.1 trillion.

Recent deficits have stemmed from large outlays. Since 1974, with an average revenue share of 17.3% of GDP and an average expenditure share of about 21% of GDP, the annual average deficit-to-GDP ratio has remained between 3% and 4%. During the same period, revenue has stayed close to the long-term average level. The current expenditure-to-GDP ratio is around 24%. The CBO forecasts that it will remain high in the coming decade, approaching 25% in 2034 while the deficit-to-GDP ratio will reach 7.7%.

To settle the fiscal balance amounting to almost US$2 trillion, it is necessary to both raise taxes and cut spending. According to the US Internal Revenue Service’s latest data in 2021, the top 5% of income earners pay approximately two-thirds of income tax, the top 25% of income earners pay almost 90% of the total tax revenue, and half of the bottom income earners pay merely 2.3% of the total tax revenue. Evidently, any tax rise should be clearly targeted and should not dampen investment.

The Tax Cuts and Jobs Act of 2017 passed during Trump’s tenure as president has reduced both personal income tax rates and the corporate tax rate. A significant part of the Act is set to expire by the end of 2025. In the event of non-renewal, the CBO forecasts that accumulated fiscal deficit in the next decade will reach US$22.1 trillion. However, if renewed, the accumulated fiscal deficit is projected to surge by an additional US$4 trillion.


Tax hikes alone unlikely to be effective

President Biden has promised not to raise taxes for families earning less than US$400,000 annually (95% of all families) but will raise taxes for the remaining 5% to accommodate the renewal of the Tax Cuts and Jobs Act of 2017. Nevertheless, experience in Europe shows that raising taxes on the rich to balance the budget, has, at best, uncertain effects.

At present, 80% of the US government’s fiscal expenditure is mandatory, with social security and healthcare being the two largest expenditure items while only 20% is discretionary, e.g. national defence and education. Apart from national defence, the actual discretionary outlay amounts to US$750 billion. With the proportion of people aged 65 or above now at 18% of the total population, annual spending on social security and healthcare has been accelerating unabated. Over the past two decades, these two items have not been subject to review by the Congress and both are in danger of running out of funding within 10 years. Needless to say, slashing expenses is easier said than done.

Excessive debt has driven up the interest costs for the federal government, which has now become the government’s third-largest expenditure item, with an average interest-cost-to-GDP ratio of over 3%. The CBO estimates that the interest cost will reach the US$1.7 trillion mark within a decade, impacting not only the operations of government agencies but also some social welfare programmes.


How will debt expansion end

It is well known that US Treasury bonds, being the largest bond asset class, play a pivotal role in the global financial system. Given that the US Treasury has to refinance around one-third of the existing debt and fund the current deficit, bond auctions may not be effective. If anything goes wrong, market confidence could be undermined. Now that the credit ratings of US Treasury bonds have been downgraded by S&P Global Ratings and Fitch Ratings, foreign investors (who hold about 25% of US debt) may therefore exert pressure on the US to implement fiscal policy changes. For instance, urged by bond vigilantes during the mid-1990s, President Bill Clinton achieved four budget surpluses in his last term of office.

In its Annual Economic Report, the Bank for International Settlements also warns that rising debt exposes governments to the risk of a crisis similar to the UK government bond market turmoil in 2022. Investors at that time shied away from UK bonds, resulting in a surge in borrowing costs, currency depreciation, and chaos in the stock market.

All in all, the sustainability of a high fiscal deficit depends on economic growth rates, interest rates, overall debt levels, and currency stability. Against the backdrop of “the rise of the East and the fall of the West”, whether the US government is strong enough to support unlimited debt expansion is an enormous challenge for the next administration.

References
1. Annual Economic Report 2024, Bank of International Settlements
2. Budget and Economic Outlook, Congressional Budget Office 2024

Read More

CPI or EPI, or Both?

From personal and family financial planning to policy formulation aimed at sustained improvement in livelihoods of the community, people’s living expenses constitute a crucial factor. As described by the Census and Statistics Department of the Hong Kong SAR Government (see Note 1), the Consumer Price Index (CPI) measures the changes over time in the price levels of consumer commodities and services typically purchased by households. A rise in the CPI indicates that, with expenses remaining unchanged, the amount of commodities and services people can buy decreases. In other words, changes in the CPI reflect the inflation faced by consumers. However, given the CPI’s discrepancies in calculating people’s daily expenses, this article discusses its limitations and also proposes using the Everyday Price Index (EPI).

Blind spots in the current index

The Census and Statistics Department announces monthly CPI changes, the predominant indicator of local price variations. The public can access the data through news media. Nevertheless, with an inadequate understanding of the CPI, people may be under the misconception that the price changes they observe in their daily activities are fully reflected in the CPI readings. As a matter of fact, a feature news report last year attempted to debunk the “myth of low inflation”. A number of the interviewees in the news story projected an actual inflation rate higher than the official data released and regarded the latter as “unrealistic” (see Note 2).

Objectively speaking, there are indeed blind spots in the CPI, which make it a less-than-ideal index of daily living costs. One of the reasons is that the less frequent expenditure section has a higher weight in the composition of the index. In the 2019/20-based Composite CPI (see Note 3) prepared by the Census and Statistics Department, housing has the highest expenditure weight, exceeding 40% (see Table). Meanwhile, expenses such as food and transport are more frequent than non-daily expenditures (e.g. rent and furniture), exerting a more notable effect on people’s impression of inflation.


Table

Sections and groups of commodity/serviceComposite Consumer Price Index (CCPI)
Overall price change100
Food27.41
Housing40.25
Electricity, gas, and water2.82
Tobacco and alcoholic drinks0.49
Clothing and footwear2.42
Durable goods4.00
Miscellaneous goods3.32
Transport6.17
Miscellaneous services13.12


Take the statistical data between 2019 and 2024, for example (see Note 4). In the Composite CPI (CCPI), the year-on-year change rates of housing are lower than those of food and transport. Due to the highest expenditure weight of housing (see Figure 1), the CPI is more susceptible to price changes in housing and less sensitive to those in daily expenses such as food and transport. Consequently, the daily living costs during this period were underestimated.


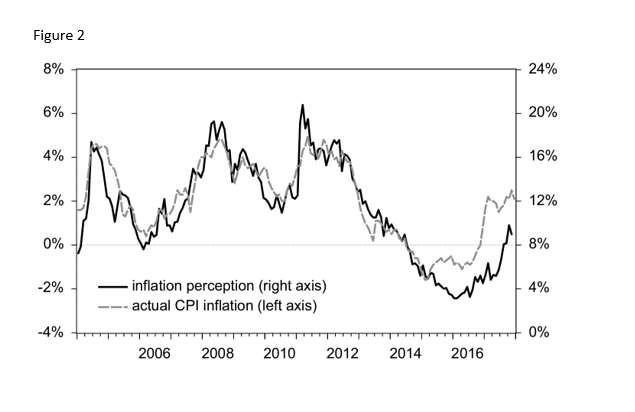
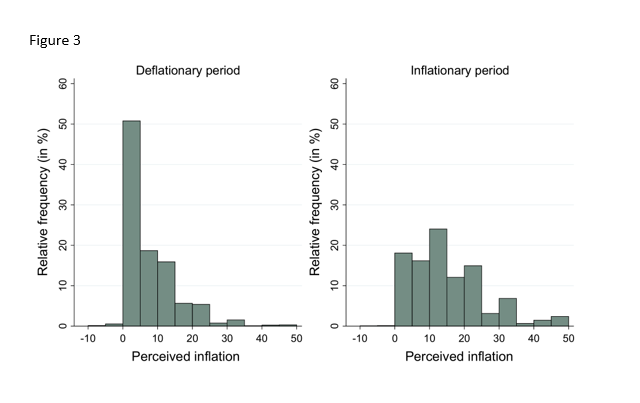
People are generally more concerned about price rises in commodities and services but are less impressed by, or aware of, price cuts, which is a form of “memory bias”. Daily-consumed commodities and services experience not only higher frequency of expenditure but also more frequent price changes. With reference to a Polish academic study (see Note 5) on consumers’ perception of year-on-year inflation rates between 2004 and 2017, up to 99% of respondents to a questionnaire survey indicated that they were unaware of the 28-month-long deflation from July 2014 to October 2016 (see Figure 2). Of these respondents, 43% stated that prices remained unchanged and 53% were under the impression that prices increased instead of decreased (see Figure 3).


Moreover, the base effect can mislead people to overestimate inflation. For instance, a $1 price rise in lettuce selling at $10 per catty at wet markets represents a 10% hike. The low base value of daily expenses can easily cause the general public to think inflation is higher than it is. The Polish study also demonstrated that even when inflation perception more or less aligned with the actual CPI inflation, respondents still overestimated inflation by an average of 10 percentage points (see Figure 2). The author further pointed out that discrepancies between the CPI and public perception of inflation were not exclusive to Poland but were also common among EU countries, suggesting that the CPI might not reasonably estimate changes in daily living costs. To summarize the above three points, the CPI as an inflation indicator does deviate from people’s daily-life experiences, thus conveying the impression of being unrealistic.

Unveiling the EPI

In view of the fact that the CPI fails to accurately measure changes in daily living costs, the American Institute of Economic Research has introduced the EPI as a more reliable price indicator (see Note 6). Unlike the CPI, the EPI covers only daily goods and services and purchasing these items cannot be readily delayed or cancelled. These goods and services must satisfy the following two requirements. First, they must be purchased frequently (at least once a month); therefore, durable goods (e.g. furniture and household electrical appliances) are excluded. Second, their prices must not be fixed for six months or more through, for example, a contract; hence, contract-bound expenses such as rent are not covered (see Note 7). The EPI more closely reflects daily expenses and can more correctly register changes in daily living costs in comparison with the CPI. In fact, the compilation of the EPI is simple and straightforward. It can be established based on the CPI by removing items not covered by the EPI and adjusting expenditure weights accordingly.

By referencing the EPI, people should be able to more effectively plan their personal financial expenditures. Not only can the grassroots obtain comprehensive and objective data when demanding wage adjustments, but the government can also have a better grasp of people’s livelihoods. In contrast, the CPI as a price indicator has been criticized because the inflation perceived by the general public deviates significantly from the actual inflation figures.

While this can be attributed to an inadequate understanding among the public regarding the composition of inflation, it is undeniable that the CPI cannot precisely reflect daily living costs. If the government continues to rely solely on such a tool, it would inevitably give the impression that it is out of touch with reality.

By approaching this issue through policy, the Government can incorporate the EPI as a reference index for social-welfare adjustments. As for the Social Security Allowance Scheme (e.g. the Old Age Allowance) and the Comprehensive Social Security Assistance Scheme, which have been pegged to the CPI, the upward adjustment of allowances has been less than ideal. Relevant policies could better benefit the public by incorporating the EPI as a more realistic indicator.

Limitations and applications of the indices

Yet, the EPI is not perfect and may overestimate the daily living costs across the community. As a matter of fact, when people see a price rise in a certain product, they naturally seek a replacement, so their actual expenses may not necessarily go up. Needless to say, spending habits vary from person to person. The EPI is for reference only and everyone should estimate changes in their expenses according to their own consumption habits.

We must emphasize that the EPI can by no means replace the CPI. It is indeed only right for the two to co-exist. While the EPI reflects changes in people’s regular daily expenses, the CPI provides an overall picture of consumer price changes in society, including both regular and irregular expenditures. The CPI is a major index widely utilized around the world. Considering the different purposes and functions of the two indices, users should be flexible when using or referencing them in various scenarios.

For instance, for the government and the academic sector, apart from recurrent expenditures, since constant monitoring of overall price changes is conducive to shaping policies and to comparing prices across regions, the CPI is a more suitable reference. When it comes to daily living costs, the EPI can more accurately reflect expense changes. For this reason, the EPI is a valuable tool for personal finance planning and a useful reference for social-welfare policy development.

Last but not least, different indices have different pros and cons. While an ideal index should be simple to use and easy to understand, users also need to grasp its uses and limitations and must not blindly accept or misuse it. Otherwise, no amount of indices can provide them with any real help.

As mentioned at the beginning of this article, given their inadequate knowledge of the CPI, members of the public often misunderstand the implications of the data. In this connection, the government should be more proactive in stepping up public education and publicity. In addition to introducing the EPI as well to account for living cost changes in response to social needs, officials should further explain to the community the uses of different indices to clear up any misconceptions.


Note 1: https://www.censtatd.gov.hk/en/data/stat_report/product/B8XX0021/att/B8XX0021.pdf

Note 2: Now Business News, 經緯線 低通脹之謎

https://www.youtube.com/watch?v=_12qhhUQM2Y&t=525s (interview duration: 08:36–10:32)

Note 3:https://www.censtatd.gov.hk/tc/EIndexbySubject.html?pcode=B8XX0029&scode=270

In addition, starting with April 2024 as the reference month, the Census and Statistics Department updated the reference period for the CPI expenditure weights to the entire year of 2023. This update does not affect the descriptions of expenditure weights in this article, except for slight differences in the actual figures.

Note 4:

https://www.censtatd.gov.hk/en/data/stat_report/product/D5600001/att/D5600001B2024MM06B.xlsx

Note 5: https://link-springer-com.eproxy.lib.hku.hk/article/10.1007/s41549-019-00036-9

Note 6: https://www.aier.org/research/capturing-shifts-in-everyday-prices/

Note 7: https://www.aier.org/wp-content/uploads/2015/07/WP004-EPI-Polina-Vlasenko-PV.pdf


Dr. Stephen Y CHIU
Honorary Associate Professor in Economics
Read More

Africa Needs More Trade for Economic Development

The three-day 2024 Summit of the Forum on China-Africa Cooperation (FOCAC) kicks off in Beijing today, marking the fourth time the meeting has been held as a summit in the past 24 years. Reportedly this is a mega event in Beijing attended by the most foreign heads of state since the COVID-19 pandemic. The last FOCAC in Beijing was held in 2018, when the trade war and suppression of Chinese high-tech industry initiated by the then US President Donald Trump just started. At that time, China’s electric vehicle industry was still under the radar, the power of artificial intelligence remained in the imagination, the carnage of the Russia-Ukraine war and Israeli-Palestinian conflict had yet to come to pass, let alone the unforeseeable worldwide ravages brought by the coronavirus pandemic spanning several years.

GDP growth requires more than raw material and agricultural exports

However, in this ever-changing world, the tumultuous turn of events over the past few years has not only radically transformed the global landscape but has also nudged Africa from a bit part to the centre of international political and economic stage. Particularly noteworthy is the admission of the African Union (AU) as a permanent member of the G20 in September 2023, giving African countries a stronger voice in international affairs. It is well-known that the G20, as the locus of the greatest political and economic power in the world, accounts for 85% of global gross domestic product (GDP) and 75% of international trade. Previously, South Africa was the only African member of the G20. With more than 50 African members, representing almost the entire continent, the AU plays a role in the G20 similar to that of the European Union (EU). Another example is that several months after the Gaza conflict, South Africa filed a case against Israel for committing genocide at the International Court of Justice. That such a small country as South Africa would take issue with major international affairs not directly related to its own interests would have been unimaginable in the past. Moreover, in addition to a wealth of natural resources, Africa also has 54 votes to offer at the United Nations.

While geopolitical change has enhanced its status, Africa’s economic performance remains lacklustre in general. As the world’s second-largest continent in terms of population and land area (20% of the Earth’s land surface), Africa boasts the youngest median age and rich reserves of natural resources. Nonetheless, it has the lowest GDP per capita, particularly in sub-Saharan Africa. According to World Bank data, in 2023, sub-Saharan Africa’s GDP per capita based on purchasing power parity stood at only US$4,374, a paltry 8.3% of that among high-income members of the Organization for Economic Cooperation and Development (OECD). Even when compared with other developing regions, it is merely 22% of that in Latin America and 52% of that in South Asia. Africa’s per-capita income compared to the global average fell from 30% in 1990 to 21% in 2023. Due to its slow economic growth, Africa is lagging farther and farther behind the global average.

When it comes to economic development after the Second World War, Asia has naturally been the top performer worldwide, with an average growth rate surpassing that of Europe, the US, and other developing economies. In Asia, Japan was the first country to achieve an economic breakthrough, followed by the “Four Little Dragons” and eventually other economies in Southeast Asia. Decades after its reform and opening-up, China has achieved unparallelled economic performance. The growth of these Asian economies shares a common factor ­­— their efforts have been geared towards strengthening trade to align with the global economy. Almost all the economies with the largest trade volumes have the highest per-capita incomes. There is a positive correlation between income and trade: higher income typically leads to greater consumption of all goods, including foreign products and services, thereby increasing imports. On the other hand, the more important point is that trade expands markets and enhances economic benefits from competition by fully leveraging relative advantages. Seen from this perspective, one reason for Africa’s slow economic development is its relatively small trade volume.

Africa’s foreign trade accounts for only 3% of the world total, representing too low a share relative to its population, land size, and resources. Over the course of its economic development, Latin America has tended to adopt import substitution policies to support domestic industries. In 2023, its trade accounts for 7.3% of the global total. By adopting export promotion policies, Asia has even boosted its share of world trade to 48%.

Africa exports raw materials, ranging from oil and minerals to agricultural products, mainly in exchange for higher value-added products. The terms of trade, i.e. ratio of export prices to import prices, are therefore unfavourable. Maintaining these trade patterns from colonial times means Africa has limited bargaining power in the international market. Meanwhile, 70% of international trade today involves manufacturing value chains, where African countries – primarily exporting raw materials and agricultural products – do not have a high level of participation. The failure of the World Trade Organization (WTO) Doha Round of negotiations has made it even more difficult to further open up the global market for agricultural products.

Leveraging the EU model to alleviate poverty for 50 million in Africa

Not only does Africa occupy just a tiny share of the global trade but the share of the continent’s domestic trade in its overall trade is also low at merely around 13%. In other words, trade between African countries and overseas countries far outweighs trade amongst African countries, a scenario different from that in other continents. The share of domestic trade is approximately 70% in European countries, 60% in Asian countries, and 40% in North American countries. Africa’s low ratio of domestic trade also has to do with the above-mentioned fact that its exports mainly consist of natural resources. Apart from oil and agricultural products, Africa has abundant reserves of minerals such as cobalt, chrome, manganese, phosphate, platinum, and diamonds, which account for over 60% or even over 70% of the world total. Since the buyers are mostly high-income industrialized nations, these products are naturally exported overseas. In addition, the high costs of domestic trade in Africa can be attributed to its backward infrastructure, inefficient customs procedures, lack of unified product standards, etc. Nevertheless, as some commentators have pointed out, Africa’s domestic trade figures have been underestimated because a significant portion bypasses customs through lengthy porous borders to evade tariffs and minimize administrative hassle. According to research estimates, illicit cross-border trade has caused Africa’s domestic trade to be underestimated by 11% to 40%.

That being said, even if Africa’s domestic trade is worth more than the official records indicate, the continent still needs to further build up its trade both continent-wide and worldwide to drive economic development. In the face of the WTO’s powerlessness and the ever-rising protectionism, Africa has no choice but to cooperate with its like-minded partners to strengthen its trade. The African Continental Free Trade Area (AfCFTA) Agreement, which took effect in 2019, is the fruit of this labour, bearing the high hopes of all partners. Developed on the basis of domestic trade agreements in the continent, the AfCTFA Agreement covers the lowering of tariffs, the formulation of origin rules, the refining of trade payment systems, along similar lines to many other trade pacts. The Agreement further aims to create a single market, reminiscent of the early stages of the EU. By now, nearly 50 African countries have joined the AfCFTA, covering nearly the entire African continent. The World Bank estimates that, if the Agreement be fully implemented, Africa’s extremely poor population would decline by 50 million by 2035 and its income would surge by 9%. This would be seen as a landmark in economic growth.

Over the years, China has maintained good economic cooperation relations with Third World countries in Asia, Africa, and Latin America. Even in the early stages of its reform and opening-up, China had already provided aid to African nations. A particularly notable case was the construction of the Tanzania-Zambia Railway project, which was supported by China in the early 1970s. To date, 52 African countries have become signatories to the Belt and Road Initiative. With the ongoing development of the initiative, it is hoped that China’s participation in a multitude of infrastructure projects in Africa will serve to establish an extensive transportation network across the continent. As a result, the transportation costs will shrink and the international trade of African countries will expand. The economic development of Africa undoubtedly encompasses numerous factors and challenges. However, given the continent’s size and population, the outcome is sure to not only benefit the African people but also facilitate the world’s overall growth.


Dr. Y. F. LUK
Honorary Associate Professor in Economics
Read More

Combat Misinformation for a Stable Economy

Dr Maurice Tse and Mr Clive Ho

28 August 2024

In this day and age, when social media is all the rage and artificial intelligence (AI) along with digital transformation are advancing in leaps and bounds, the rampant production and dissemination of information can influence personal behaviour and investment decisions. The phenomenon may also potentially incite panic in society and the market, giving rise to a credibility crisis. In January 2024, the World Economic Forum declared misinformation and disinformation as the greatest short-term risks worldwide.

How can inaccurate information and deceiving information be so alarmingly destructive? The answer lies in the fact that, when deployed with conspiracy theories, such information can come across as fully credible, leaving the general public completely at its mercy. With the world being constantly flooded with information that is hard to verify, political polarization becoming increasingly prevalent, and the global economic downturn showing no sign of abating, rumours and conjectures abound. These range from conspiracy theories about currency wars to allegations that the US moon landing was faked.

The steep price of hocus-pocus

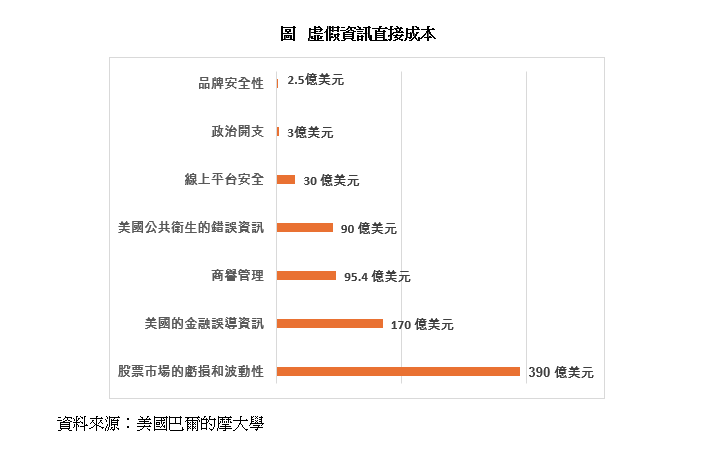
Time is of utmost importance in financial investment. Even within the infinitesimal span of a few milliseconds, a single news update or social media post can trigger price fluctuations in the market. In 2019, Roberto Cavazos, a professor at the University of Baltimore’s School of Business in the US, and the cybersecurity company CHEQ jointly published a research report (see 【Note 1】). The publication drew attention to the fact that every year, stock market losses resulting from fake news amount to US$39 billion. Investors’ decisions influenced by misinformation sustain losses of around US$17 billion on an annual basis (see Figure).

For companies targeted by disinformation attacks, their annual expenditure on reputation management reaches approximately US$9.54 billion. Their annual expenditure on addressing false information in the healthcare sector is around US$9 billion, with the greatest costs incurred in measures to combat fake news about the anti-vaccine campaign and climate change. Global losses induced by disinformation amount to a total of US$78.2 billion.

Financial losses for many in pump and dump schemes

It is widely known that political election campaigns are not immune to disinformation. Research shows that approximately US$300 million is spent annually on phoney political ads. During the 2020 US presidential election, at least US$200 million was spent on fake news. As also indicated by researchers, their estimates only illustrate the basic direct costs. The real underlying costs far exceed the estimated figures.

Of the journalists surveyed in a report released by the US Pew Research Centre in 2022, 26% of the respondents indicate that they have unknowingly reported news containing disinformation. In their opinion, identifying disinformation is more and more challenging, especially as the advancement of AI technology facilitates the spread of false information. According to a 2023 survey conducted by the insurance company Nationwide, 34% of American non-retiree investors aged between 18 and 54 have been influenced to make investments based on misleading financial information (e.g. pump and dump schemes) found on the internet or social media. Not only have investors suffered losses but the market’s credibility has also been undermined as a result.

As mentioned in the research study by Arcuri et al. published in the Journal of Economics and Business in 2023 (see 【Note 2】), some investors might be unable to agree on the true value of a company due to their failure to distinguish between real and fake news. Consequently, the target company’s stock price dances to the tune of disinformation. The study analyses fake news originating from overseas but released in America and Europe from 2007 to 2019. In terms of stock returns, the findings demonstrate that unfavourable fake news generates substantial short-term negative impacts while favourable or neutral news has minimal impacts.

Conspiracy theories bleeding into economics

What is even worse, under the echo-chamber effect of social media, all sorts of unverifiable conspiracy theories have gained wide currency and approval. One notable example is the allegation that the government of an economic power has been tampering with its GDP, inflation, and employment figures to window-dress the domestic economy. As a matter of fact, this absurd way of thinking does not hold water because such large-scale economic data require rigorous statistical methods, involving input from countless independent statisticians and scholars.

All statistical reports must be meticulously reviewed by economists and analysts from around the world, making it virtually impossible to conceal any major frauds. Should investors fall for such conspiracy theories and make irrational decisions, e.g. hoarding commodities or abandoning the stock market altogether, the long-term growth of their investment portfolios could be compromised.

Furthermore, there are also conspiracy theorists who claim that the central bank of another economic power is harbouring a secret agenda to benefit a few at the expense of the majority by manipulating interest rates and the monetary policy. This rumour is nothing but ridiculous. Under strict supervision, the central bank’s operations are extremely transparent, with all its comprehensive reports and meeting minutes made public. Allegations of the so-called secret agenda are not only utterly groundless but simply do not square with the accountability mechanisms in place. If investors are misled into bypassing traditional investment channels or making rash decisions, national financial stability and growth could be jeopardized.

Despite the fact that allegations of insider trading and stock market manipulation are also common, security trading regulators in leading markets are generally dedicated to combating these irregularities. Given the immense scope and complexity of the stock market, it is extremely unlikely that a small number of individuals could control it systematically. While factors influencing market dynamics are many, including economic data, business performance, and geopolitical risks, investors misled by disinformation could lose their faith in the market or even withdraw from investment activities. They may, therefore, miss wealth-creation opportunities in the stock market, particularly those for long-term asset gains.

There is yet another group of conspiracy theorists known as the “gold bugs”. They claim that with the imminent collapse of the traditional fiat currencies (for instance, the US dollar) and the emergence of economic recession or hyperinflation, gold is the only safe-haven asset.

They also believe that central banks and national governments attempt to suppress gold prices through manipulation in order to prevent the general public from abandoning traditional currencies. Although gold is indeed an asset with intrinsic value, it is by no means immune to market fluctuations, nor is it likely to offer the kind of stable returns produced by diversified investments.

This group of conspiracy theorists obviously overlook the reality that gold prices are shaped by a basket of factors, ranging from supply and demand to investor sentiments and the macroeconomic environment. The view that governments suppress gold prices is not only baseless but also dismissive of the transparency of the gold market and the extent to which the market is regulated. Investors misled by this conspiracy theory may become exceedingly reliant on gold. Failing to diversify their investments will only increase their investment risks and limit their potential returns.

Setting the record straight to safeguard against losses  

So long as social media or other platforms keep being the fertile ground for churning out distorted information and the general public continue to have knee-jerk reactions to news, the global economy will remain susceptible to constant risks of deception. By taking advantage of potential panic, conspiracy theorists undermine ordinary people’s logical reasoning and analytical abilities, leaving them as sitting ducks for brainwashing and outrageous rumours. Hence, whenever we come across sensational articles attempting to manipulate readers’ emotions with expressions such as “hot off the press”, “breaking news”, “going viral”, or other similar clickbait headlines, we should be ultra-alert and beware of malicious disinformation.

As the saying goes, “Lies repeated a thousand times will become truth.” That is why critical thinking starts with us. Before forwarding a message, we should ensure the source is reliable, the content is reasonable or objective, and the views are based on facts or science. These basic criteria can help us to sort out signal from noise. Not only can investors benefit from this, but the impact of heavy losses incurred by disinformation on the world’s economy can also be mitigated.


【Note 1】: Cavazos, R., and CHEQ. 2019. “The Economic Cost of Bad Actors on the Internet: Fake News in 2019”.
【Note 2】: Arcuri, M.C., Gandolfi, G., and Russo, T. May-June 2023. “Does fake news impact stock returns? Evidence from US and EU stock markets”. Journal of Economics and Business vol.125-126.

Read More

Combat Misinformation for a Stable Economy

Dr Maurice Tse and Mr Clive Ho

28 August 2024

In this day and age, when social media is all the rage and artificial intelligence (AI) along with digital transformation are advancing in leaps and bounds, the rampant production and dissemination of information can influence personal behaviour and investment decisions. The phenomenon may also potentially incite panic in society and the market, giving rise to a credibility crisis. In January 2024, the World Economic Forum declared misinformation and disinformation as the greatest short-term risks worldwide.

How can inaccurate information and deceiving information be so alarmingly destructive? The answer lies in the fact that, when deployed with conspiracy theories, such information can come across as fully credible, leaving the general public completely at its mercy. With the world being constantly flooded with information that is hard to verify, political polarization becoming increasingly prevalent, and the global economic downturn showing no sign of abating, rumours and conjectures abound. These range from conspiracy theories about currency wars to allegations that the US moon landing was faked.

The steep price of hocus-pocus

Time is of utmost importance in financial investment. Even within the infinitesimal span of a few milliseconds, a single news update or social media post can trigger price fluctuations in the market. In 2019, Roberto Cavazos, a professor at the University of Baltimore’s School of Business in the US, and the cybersecurity company CHEQ jointly published a research report (see 【Note 1】). The publication drew attention to the fact that every year, stock market losses resulting from fake news amount to US$39 billion. Investors’ decisions influenced by misinformation sustain losses of around US$17 billion on an annual basis (see Figure).

For companies targeted by disinformation attacks, their annual expenditure on reputation management reaches approximately US$9.54 billion. Their annual expenditure on addressing false information in the healthcare sector is around US$9 billion, with the greatest costs incurred in measures to combat fake news about the anti-vaccine campaign and climate change. Global losses induced by disinformation amount to a total of US$78.2 billion.

Financial losses for many in pump and dump schemes

It is widely known that political election campaigns are not immune to disinformation. Research shows that approximately US$300 million is spent annually on phoney political ads. During the 2020 US presidential election, at least US$200 million was spent on fake news. As also indicated by researchers, their estimates only illustrate the basic direct costs. The real underlying costs far exceed the estimated figures.

Of the journalists surveyed in a report released by the US Pew Research Centre in 2022, 26% of the respondents indicate that they have unknowingly reported news containing disinformation. In their opinion, identifying disinformation is more and more challenging, especially as the advancement of AI technology facilitates the spread of false information. According to a 2023 survey conducted by the insurance company Nationwide, 34% of American non-retiree investors aged between 18 and 54 have been influenced to make investments based on misleading financial information (e.g. pump and dump schemes) found on the internet or social media. Not only have investors suffered losses but the market’s credibility has also been undermined as a result.

As mentioned in the research study by Arcuri et al. published in the Journal of Economics and Business in 2023 (see 【Note 2】), some investors might be unable to agree on the true value of a company due to their failure to distinguish between real and fake news. Consequently, the target company’s stock price dances to the tune of disinformation. The study analyses fake news originating from overseas but released in America and Europe from 2007 to 2019. In terms of stock returns, the findings demonstrate that unfavourable fake news generates substantial short-term negative impacts while favourable or neutral news has minimal impacts.

Conspiracy theories bleeding into economics

What is even worse, under the echo-chamber effect of social media, all sorts of unverifiable conspiracy theories have gained wide currency and approval. One notable example is the allegation that the government of an economic power has been tampering with its GDP, inflation, and employment figures to window-dress the domestic economy. As a matter of fact, this absurd way of thinking does not hold water because such large-scale economic data require rigorous statistical methods, involving input from countless independent statisticians and scholars.

All statistical reports must be meticulously reviewed by economists and analysts from around the world, making it virtually impossible to conceal any major frauds. Should investors fall for such conspiracy theories and make irrational decisions, e.g. hoarding commodities or abandoning the stock market altogether, the long-term growth of their investment portfolios could be compromised.

Furthermore, there are also conspiracy theorists who claim that the central bank of another economic power is harbouring a secret agenda to benefit a few at the expense of the majority by manipulating interest rates and the monetary policy. This rumour is nothing but ridiculous. Under strict supervision, the central bank’s operations are extremely transparent, with all its comprehensive reports and meeting minutes made public. Allegations of the so-called secret agenda are not only utterly groundless but simply do not square with the accountability mechanisms in place. If investors are misled into bypassing traditional investment channels or making rash decisions, national financial stability and growth could be jeopardized.

Despite the fact that allegations of insider trading and stock market manipulation are also common, security trading regulators in leading markets are generally dedicated to combating these irregularities. Given the immense scope and complexity of the stock market, it is extremely unlikely that a small number of individuals could control it systematically. While factors influencing market dynamics are many, including economic data, business performance, and geopolitical risks, investors misled by disinformation could lose their faith in the market or even withdraw from investment activities. They may, therefore, miss wealth-creation opportunities in the stock market, particularly those for long-term asset gains.

There is yet another group of conspiracy theorists known as the “gold bugs”. They claim that with the imminent collapse of the traditional fiat currencies (for instance, the US dollar) and the emergence of economic recession or hyperinflation, gold is the only safe-haven asset.

They also believe that central banks and national governments attempt to suppress gold prices through manipulation in order to prevent the general public from abandoning traditional currencies. Although gold is indeed an asset with intrinsic value, it is by no means immune to market fluctuations, nor is it likely to offer the kind of stable returns produced by diversified investments.

This group of conspiracy theorists obviously overlook the reality that gold prices are shaped by a basket of factors, ranging from supply and demand to investor sentiments and the macroeconomic environment. The view that governments suppress gold prices is not only baseless but also dismissive of the transparency of the gold market and the extent to which the market is regulated. Investors misled by this conspiracy theory may become exceedingly reliant on gold. Failing to diversify their investments will only increase their investment risks and limit their potential returns.

Setting the record straight to safeguard against losses  

So long as social media or other platforms keep being the fertile ground for churning out distorted information and the general public continue to have knee-jerk reactions to news, the global economy will remain susceptible to constant risks of deception. By taking advantage of potential panic, conspiracy theorists undermine ordinary people’s logical reasoning and analytical abilities, leaving them as sitting ducks for brainwashing and outrageous rumours. Hence, whenever we come across sensational articles attempting to manipulate readers’ emotions with expressions such as “hot off the press”, “breaking news”, “going viral”, or other similar clickbait headlines, we should be ultra-alert and beware of malicious disinformation.

As the saying goes, “Lies repeated a thousand times will become truth.” That is why critical thinking starts with us. Before forwarding a message, we should ensure the source is reliable, the content is reasonable or objective, and the views are based on facts or science. These basic criteria can help us to sort out signal from noise. Not only can investors benefit from this, but the impact of heavy losses incurred by disinformation on the world’s economy can also be mitigated.

【Note 1】: Cavazos, R., and CHEQ. 2019. “The Economic Cost of Bad Actors on the Internet: Fake News in 2019”.
【Note 2】: Arcuri, M.C., Gandolfi, G., and Russo, T. May-June 2023. “Does fake news impact stock returns? Evidence from US and EU stock markets”. Journal of Economics and Business vol.125-126.

Read More